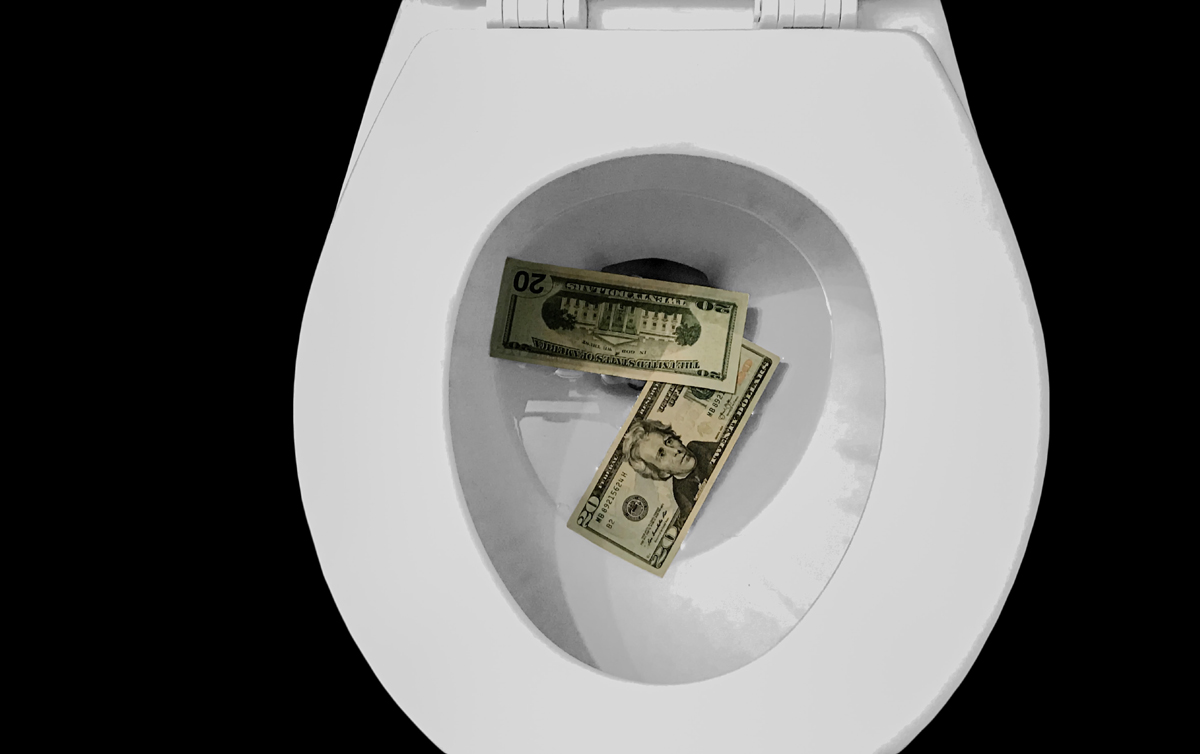
Public Education Performance Dashboards show no correlation between spending and student proficiency
By Nicole Davis
On Nov. 6, the Office of the State Auditor announced the release of additional public education dashboards comparing spending with student performance. These new dashboards visually display student proficiency versus average student spending on a district-by-district basis. These dashboards integrate data that is collected and published by the Utah State Board of Education. These dashboards are designed to make it easier for the public to analyze K-12 spending versus student proficiency and growth in proficiency.
According to the Utah State Board of Education, on average, students achieved the following proficiency on statewide tests for school year 2018–19:
—Mathematics: 46 percent.
—Language Arts: 45 percent.
—Science: 48 percent.
This is likely lower than many Utahns would expect. Unfortunately, the dashboards show that there does not appear to be any correlation between spending levels and student proficiency.
“While many taxpayers expect more money would result in greater student achievement, that does not appear to be Utah’s current reality.,” said State Auditor John Dougall. “There does not appear to be any clear connection between per-student spending and student success on statewide tests. Utah’s System of Public Education should identify better ways to align its financial resources to improve student learning and achievement.”
A recent article in the Wall Street Journal offers some national perspective on education funding: “But between 2012 and 2017 — the last year of available Census Bureau data — average per-pupil education spending increased by 15%. Spending has been growing at an even faster clip over the last couple of years as government revenue has recovered from the recession. States that are spending more haven’t shown improvement. In California annual K-12 spending has increased by more than half since 2013 to $102 billion. Yet student test scores have been flat since 2013. It’s a similar story in New York, Illinois and New Jersey where Democrats have raised taxes for schools.”
These dashboards are part of a larger effort by the Office of the State Auditor to analyze education spending and spending effectiveness. Project KIDS is an innovative performance audit that is currently integrating key data across Utah’s system of public education. Project KIDS is intended to help the public, policymakers, and public education professionals better understand how money reaches the classroom and its impact on student learning.
These public education dashboards may be found at auditor.utah.gov/audit_reports/public-education.
Articles related to “Public Education Performance Dashboards show no correlation between spending and student proficiency”
Office of the State Auditor releases audit of educator misconduct
Office of the State Auditor releases “The Cost of Yesterday’s Pension Promises to Public Education”


